
- Mo 06 März 2017
- MetaAnalysis
- Peter Schuhmacher
- #Statistics, #Python, #Bayesian
>> Draft <<
import matplotlib.pyplot as plt
import numpy as np
import matplotlib.gridspec as gridspec
import matplotlib.patches as patches
%matplotlib inline
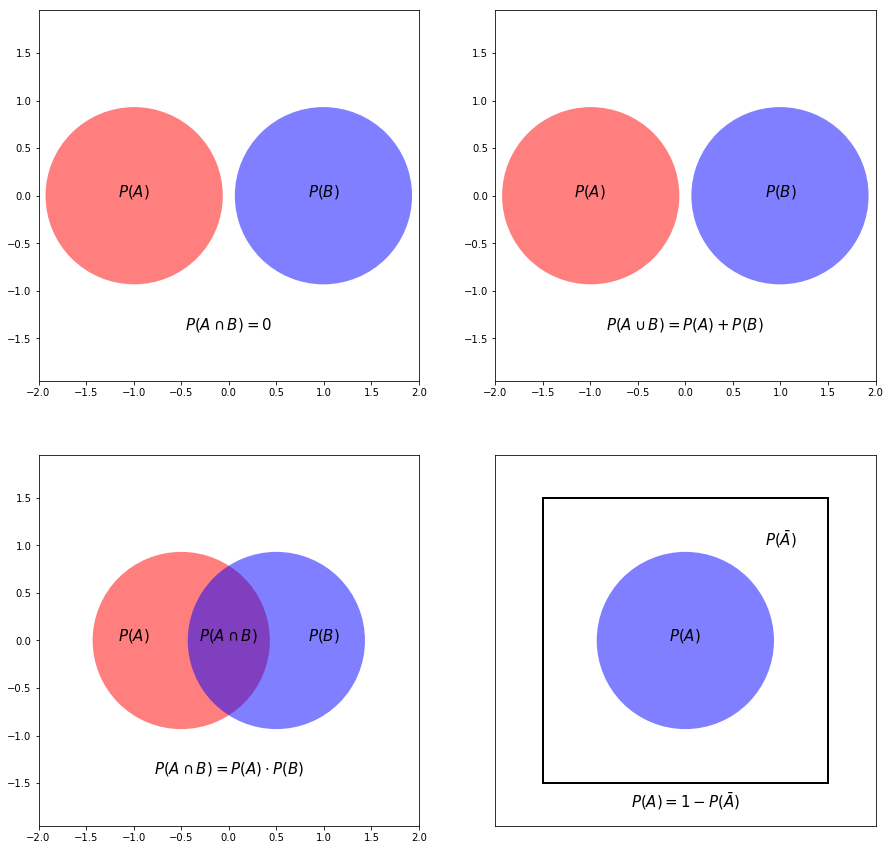
p_independent()
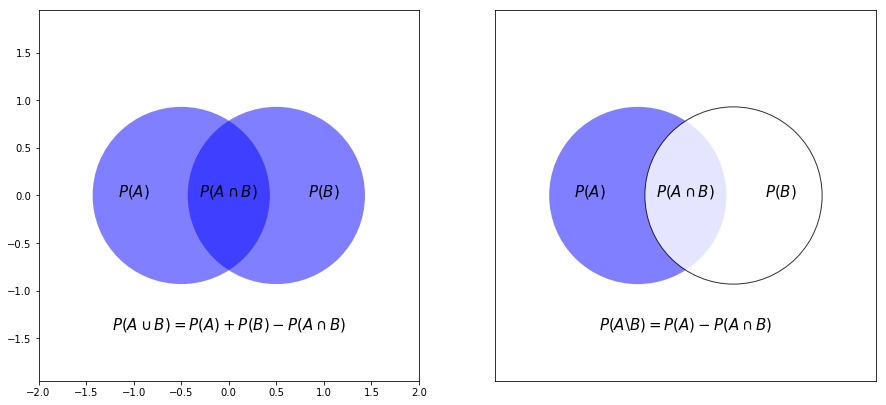
p_dependent()
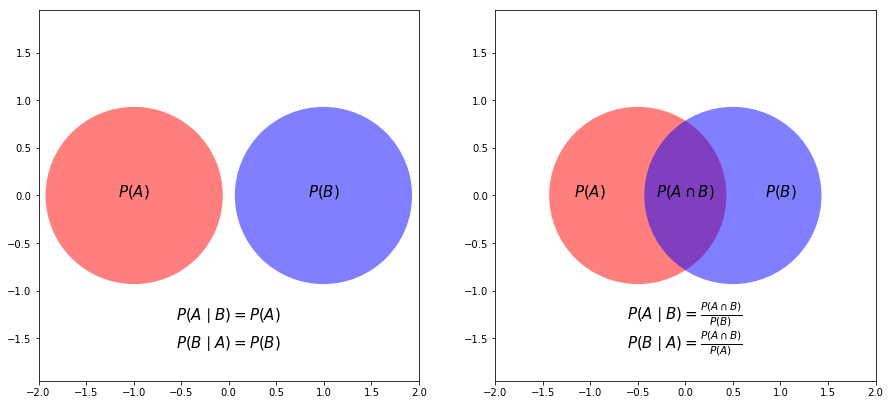
p_conditional()
A bridge to Bayes Rule
With the conditional probabilities
$$
P(A \mid B) = \frac{P(A \cap B)} {P(B)} \;\; and \;\; P(B \mid A) = \frac{P(A \cap B)} {P(A)}
$$
we find by eliminating \(P(A \cap B)\) to
$$
P(A \mid B) \cdot P(B) = P(B \mid A) \cdot P(A)
$$
and from here to the Bayesian rule
$$P(A \mid B) = \frac{P(B \mid A) \cdot P(A)}{P(B)}$$$$P(B \mid A) = \frac{P(A \mid B) \cdot P(B)}{P(A)}$$
Note that there is a quite natural and less abstract way to the Bayesian formula when using contingency tables (also known as a cross tabulation or crosstab).
Code for the graphics
def p_independent():
    rad  = 100.0
    area = np.pi * rad**2
    colors = np.array(['r','b'])

    figX = 15; figY = 15
    fig = plt.subplots(figsize=(figX, figY))
    gs = gridspec.GridSpec(2, 2,width_ratios=[1,1],height_ratios=[1,1])

    ipic = 0; ax1 = plt.subplot(gs[ipic])
    x    = np.array([-0.995, 0.995])
    y    = np.array([ 0.0, 0.0])
    ax1.scatter(x, y, s=area, c=colors, alpha=0.5,edgecolor='', lw = 4)
    ax1.axis('equal')
    ax1.axis([-2.0, 2.0, -2.0, 2.0])
    ax1.annotate(r'$P(A)$',
            xy=(-1.0, 0), xycoords='data', size = 15,horizontalalignment='center')
    ax1.annotate(r'$P(B)$',
            xy=( 1.0, 0), xycoords='data', size = 15,horizontalalignment='center')
    ax1.annotate(r'$P(A \cap B) = 0$',
            xy=(0.0, -1.4), xycoords='data', size = 15,horizontalalignment='center')

    ipic = 1; ax1 = plt.subplot(gs[ipic])
    ax1.scatter(x, y, s=area,c=colors, alpha=0.5,edgecolor='', lw = 4)
    ax1.axis('equal')
    ax1.axis([-2.0, 2.0, -2.0, 2.0])
    ax1.annotate(r'$P(A)$',
            xy=(-1.0, 0), xycoords='data', size = 15,horizontalalignment='center')
    ax1.annotate(r'$P(B)$',
            xy=( 1.0, 0), xycoords='data', size = 15,horizontalalignment='center')
    ax1.annotate(r'$P(A \cup B) = P(A) + P(B)$',
            xy=(0.0, -1.4), xycoords='data', size = 15,horizontalalignment='center')

    x    = np.array([-0.5, 0.5])
    y    = np.array([ 0.0, 0.0])

    ipic = 2; ax1 = plt.subplot(gs[ipic])
    ax1.scatter(x, y, s=area, c=colors, alpha=0.5,edgecolor='', lw = 4)
    ax1.axis('equal')
    ax1.axis([-2.0, 2.0, -2.0, 2.0])
    ax1.annotate(r'$P(A)$',
            xy=(-1.0, 0), xycoords='data', size = 15,horizontalalignment='center')
    ax1.annotate(r'$P(B)$',
            xy=( 1.0, 0), xycoords='data', size = 15,horizontalalignment='center')
    ax1.annotate(r'$P(A \cap B)$',
            xy=( 0.0, 0), xycoords='data', size = 15,horizontalalignment='center')
    ax1.annotate(r'$P(A \cap B) = P(A) \cdot P(B)$',
            xy=( 0.0, -1.4), xycoords='data', size = 15,horizontalalignment='center')

    ipic = 3; ax2 = plt.subplot(gs[ipic])
    x    = np.array([-0.0, 0.0])
    y    = np.array([ 0.0, 0.0])
    ax2.add_patch(patches.Rectangle( (-1.5,-1.5),    # (x,y)
                                   3.0, 3.0,     # width, height
                                   facecolor="k", fill=False, alpha=0.999,
                                   edgecolor="k", linewidth=2))

    ax2.scatter(0.0, 0.0, s=area, c='blue', alpha=0.5, edgecolor='', lw = 4)
    ax2.axis('equal')
    ax2.axis([-2.0, 2.0, -2.0, 2.0])
    ax2.annotate(r'$P(A)$',
            xy=(0.0, 0), xycoords='data', size = 15,horizontalalignment='center')
    ax2.annotate(r'$P(\bar A)$',
            xy=( 1.0, 1.0), xycoords='data', size = 15,horizontalalignment='center')
    ax2.annotate(r'$P(A) = 1 - P(\bar A)$',
            xy=(0.0, -1.75), xycoords='data', size = 15,horizontalalignment='center')
    #ax2.axis('off')
    ax2.tick_params(axis='both', which='both', bottom='off', top='off',
                labelbottom='off', right='off', left='off', labelleft='off')
    return
def p_dependent():
    rad  = 100.0
    area = np.pi * rad**2
    colors = np.array(['r','b'])

    figX = 15; figY = 15
    fig = plt.subplots(figsize=(figX, figY))
    gs = gridspec.GridSpec(2, 2,width_ratios=[1,1],height_ratios=[1,1])

    x    = np.array([-0.5, 0.5])
    y    = np.array([ 0.0, 0.0])

    ipic = 0; ax1 = plt.subplot(gs[ipic])
    colors = np.array(['b','b'])
    ax1.scatter(x, y, s=area,c=colors, alpha=0.5, edgecolor='', lw = 4)
    ax1.axis('equal')
    ax1.axis([-2.0, 2.0, -2.0, 2.0])
    ax1.annotate(r'$P(A)$',
            xy=(-1.0, 0), xycoords='data', size = 15,horizontalalignment='center')
    ax1.annotate(r'$P(B)$',
            xy=( 1.0, 0), xycoords='data', size = 15,horizontalalignment='center')
    ax1.annotate(r'$P(A \cap B)$',
            xy=( 0.0, 0), xycoords='data', size = 15,horizontalalignment='center')
    ax1.annotate(r'$P(A \cup B) = P(A) + P(B) - P(A \cap B)$',
            xy=( 0.0, -1.4), xycoords='data', size = 15,horizontalalignment='center')


    ipic = 1; ax2 = plt.subplot(gs[ipic])
    x    = np.array([-0.0, 0.0])
    y    = np.array([ 0.0, 0.0])
    ax2.scatter(-0.5, 0.0, s=area, c='blue', alpha=0.5, edgecolor='', lw = 4)
    ax2.scatter( 0.5, 0.0, s=area, c='w',    alpha=0.8, edgecolor='k', lw = 1)
    ax2.axis('equal')
    ax2.axis([-2.0, 2.0, -2.0, 2.0])
    ax2.annotate(r'$P(A)$',
            xy=(-1.0, 0), xycoords='data', size = 15,horizontalalignment='center')
    ax2.annotate(r'$P(B)$',
            xy=( 1.0, 0), xycoords='data', size = 15,horizontalalignment='center')
    ax2.annotate(r'$P(A \backslash B) = P(A) - P(A \cap B)$',
            xy=(0.0, -1.4), xycoords='data', size = 15,horizontalalignment='center')
    ax2.annotate(r'$P(A \cap B)$',
            xy=( 0.0, 0.0), xycoords='data', size = 15,horizontalalignment='center')
    #ax2.axis('off')
    ax2.tick_params(axis='both', which='both', bottom='off', top='off',
                labelbottom='off', right='off', left='off', labelleft='off')
    return
def p_conditional():
    rad  = 100.0
    area = np.pi * rad**2
    colors = np.array(['r','b'])

    figX = 15; figY = 15;
    fig = plt.subplots(figsize=(figX, figY))
    gs = gridspec.GridSpec(2, 2,width_ratios=[1,1],height_ratios=[1,1])

    ipic = 0; ax1 = plt.subplot(gs[ipic])
    x    = np.array([-0.995, 0.995])
    y    = np.array([ 0.0, 0.0])
    ax1.scatter(x, y, s=area, c=colors, alpha=0.5,edgecolor='', lw = 4)
    ax1.axis('equal')
    ax1.axis([-2.0, 2.0, -2.0, 2.0])
    ax1.annotate(r'$P(A)$',
            xy=(-1.0, 0), xycoords='data', size = 15,horizontalalignment='center')
    ax1.annotate(r'$P(B)$',
            xy=( 1.0, 0), xycoords='data', size = 15,horizontalalignment='center')
    ax1.annotate(r'$P(A \mid B) = P(A)$',
            xy=(0.0, -1.3), xycoords='data', size = 15,horizontalalignment='center')
    ax1.annotate(r'$P(B \mid A) = P(B)$',
            xy=(0.0, -1.6), xycoords='data', size = 15,horizontalalignment='center')

    x = np.array([-0.5, 0.5])
    y = np.array([ 0.0, 0.0])

    ipic = 1; ax1 = plt.subplot(gs[ipic])
    ax1.scatter(x, y, s=area, c=colors, alpha=0.5,edgecolor='', lw = 4)
    ax1.axis('equal')
    ax1.axis([-2.0, 2.0, -2.0, 2.0])
    ax1.annotate(r'$P(A)$',
            xy=(-1.0, 0), xycoords='data', size = 15,horizontalalignment='center')
    ax1.annotate(r'$P(B)$',
            xy=( 1.0, 0), xycoords='data', size = 15,horizontalalignment='center')
    ax1.annotate(r'$P(A \cap B)$',
            xy=( 0.0, 0), xycoords='data', size = 15,horizontalalignment='center')
    ax1.annotate(r'$P(A \mid B) = \frac{P(A \cap B)} {P(B)}$',
            xy=( 0.0, -1.3), xycoords='data', size = 15,horizontalalignment='center');
    ax1.annotate(r'$P(B \mid A) = \frac{P(A \cap B)} {P(A)}$',
            xy=( 0.0, -1.6), xycoords='data', size = 15,horizontalalignment='center');
    return