- Di 16 Oktober 2018
- GenerativeArt
- Peter Schuhmacher
- #Python
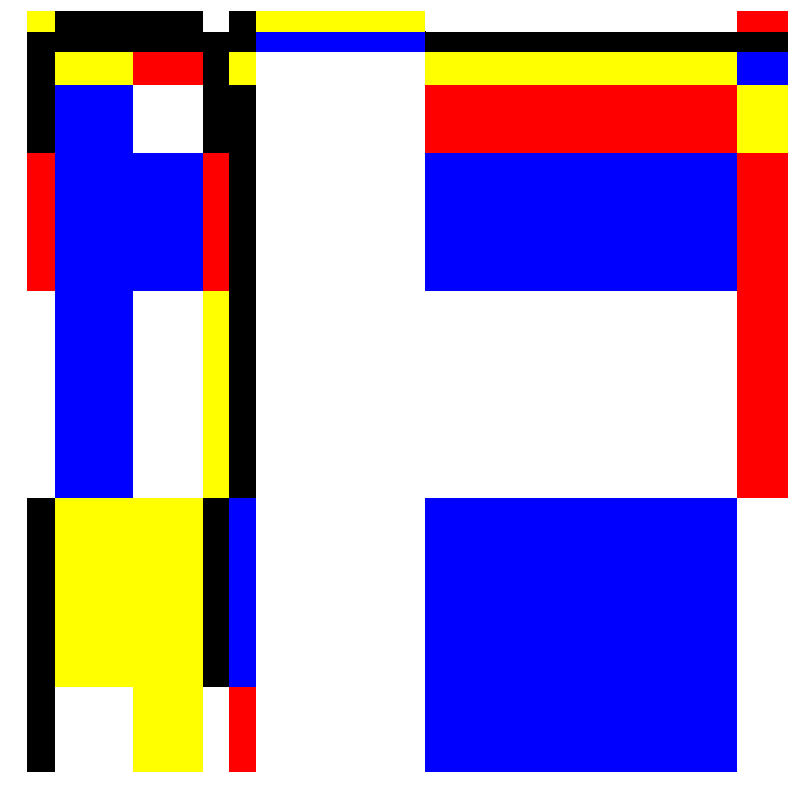
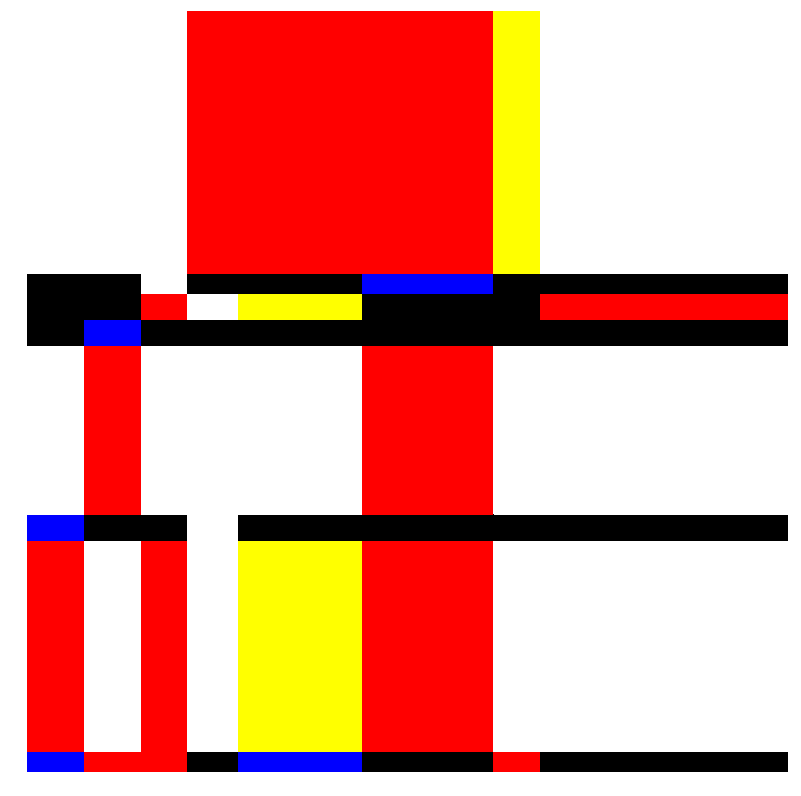
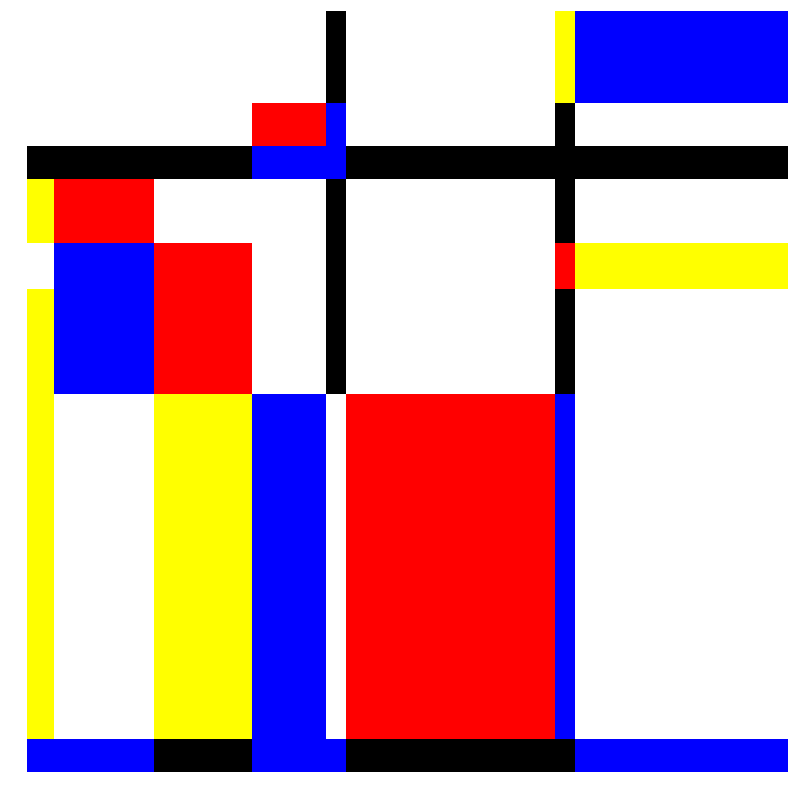
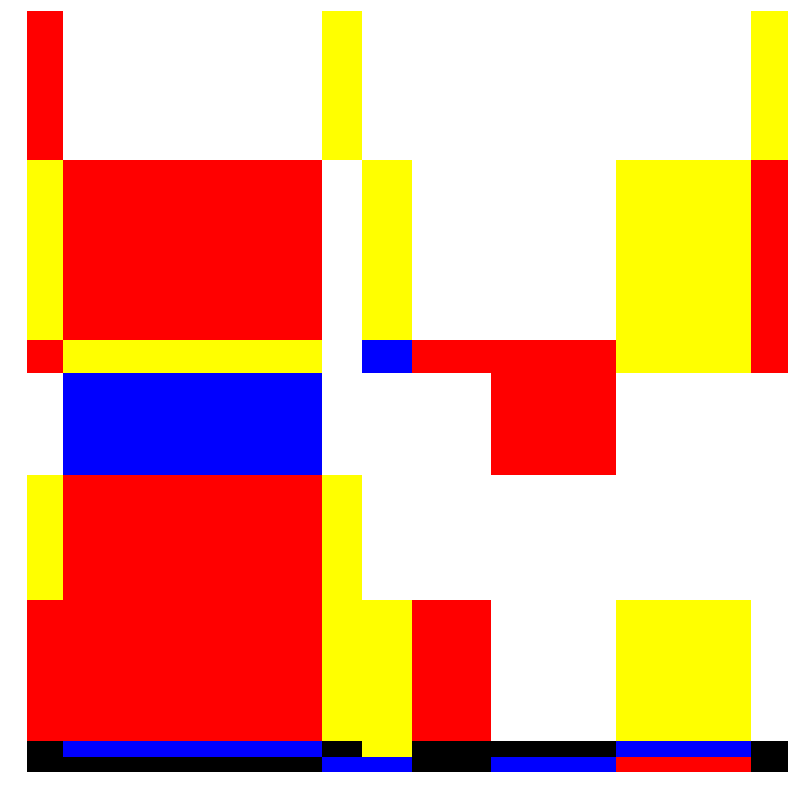
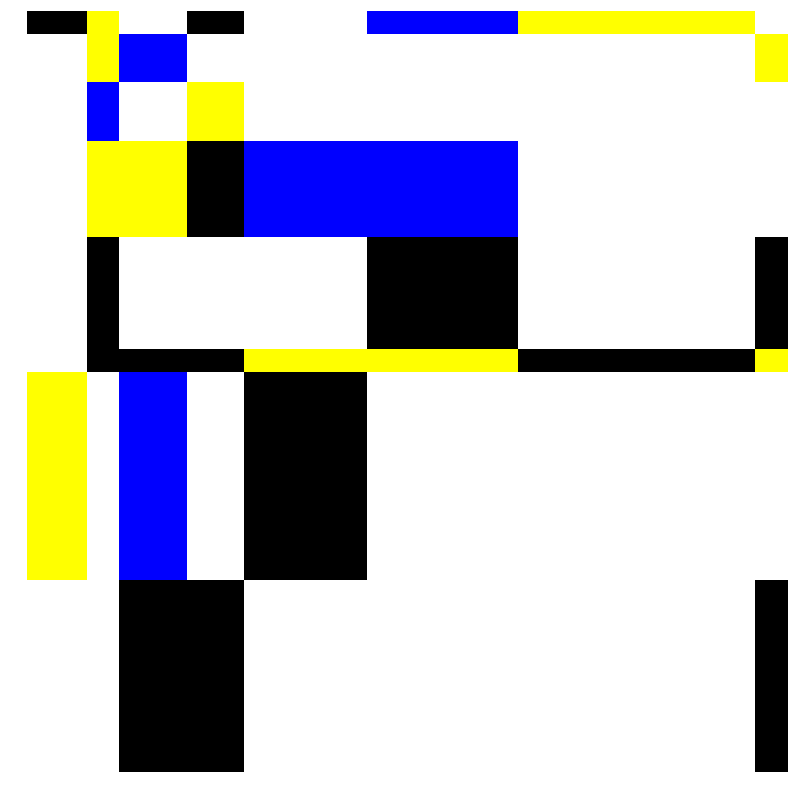
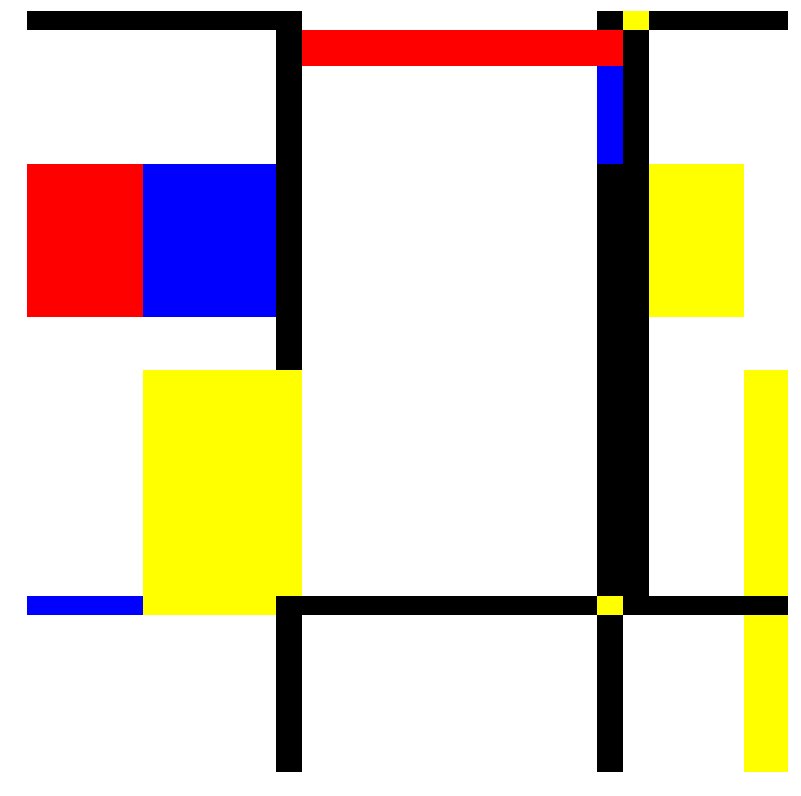
The reduced set of colors and the rectangular compositions of Piet Mondrian's images in his avant-gardistic phase invite to try out some algorithmic image generation.
What's in the code
In the following code we have implemented the following rules:
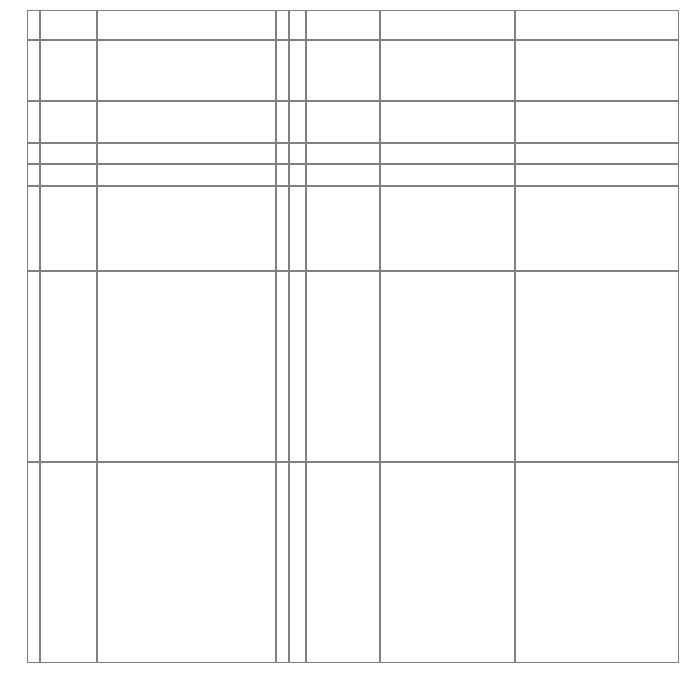
- we construct a grid where the distances between the grid lines are choosen randomly.
- if all area elements are mid-sized the images are boring. So we repeat step 1 until we have a few areas with small sides too.
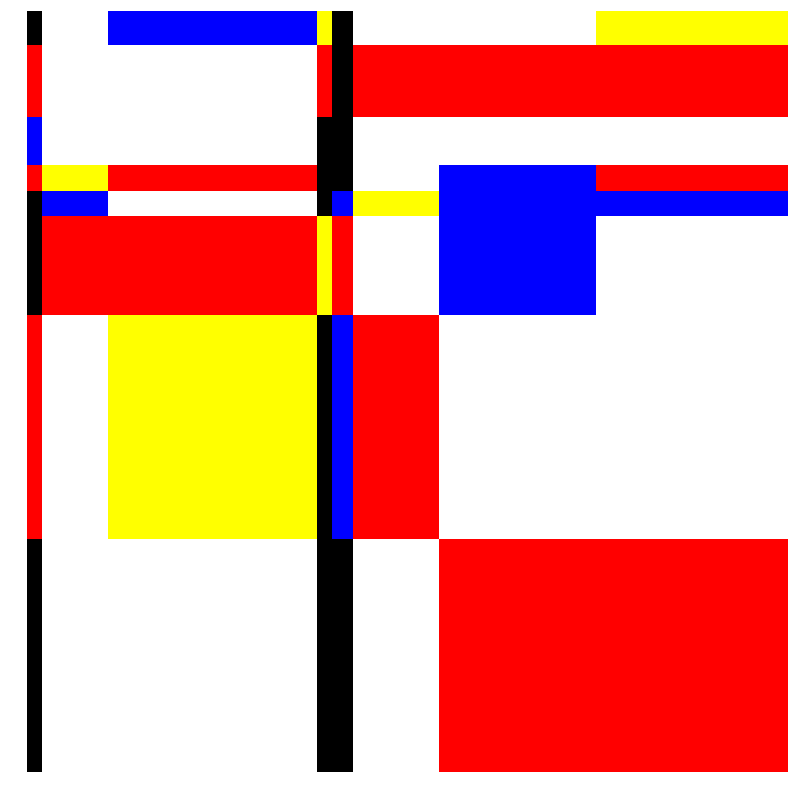
- We assign randomly each area element a color weighted with a probablity:
- white has the highest probability to be choosen, black the lowest, whereas blue, red and yellow are in between
- for areas with a small side it's reverse: black has the highest probability to be choosen, white the lowest
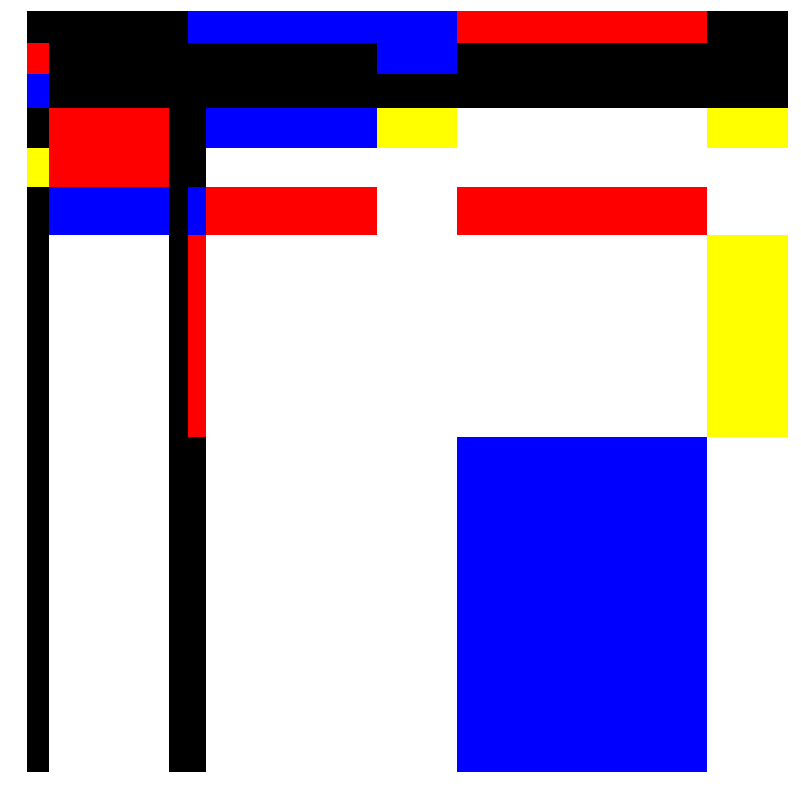
Room for improvements
A more systematic approach would include both
- construction rules
- rejection rules
The formulation of construction rules requires an in depth analysis of Mondrian's artistics work (what we have not done). The target of this step is to generate an image "as good as possible".
Once a image is generated, the rejection rules have to discard certain combinations. E.g. two neighbouring areas with small sides should never have the same color.
import sys
import numpy as np
from PIL import Image
import matplotlib.pylab as plt
import matplotlib.colors as mclr
np.set_printoptions(linewidth=200, precision=3)

def scale(a): return (a-np.min(a))/(np.max(a)-np.min(a))

def generate_grid(nx,ny, Lx,Ly, Dx,Dy):
    def check_line(dx,dy,Dx,Dy):
        dx,dy = scale(dx), scale(dy)
        dx,dy = np.sort(dx), np.sort(dy)
        th = 0.001
        flag = True
        if (dx[1]< th) and (dy[1]< th): flag=False
        return flag

    #--- model the distances
    noFlag = True
    while noFlag:
        dx = Dx+np.exp(np.random.uniform(0, 3, nx-1))
        dy = Dy+np.exp(np.random.uniform(0, 3, ny-1))
        noFlag = check_line(dx,dy,Dx,Dy)

    #--- compute the grid
    ix,iy = np.r_[0,np.cumsum(dx)],  np.r_[0,np.cumsum(dy)]
    ix,iy = Lx*scale(ix), Ly*scale(iy)
    x = np.outer(ix,np.ones_like(iy))
    y = np.outer(np.ones_like(ix),iy)

    #--- compute the areas
    fx,fy = np.r_[dx,0],  np.r_[dy,0]
    A = np.outer(fx, fy)
    return x,y,fx,fy

def plot_grid(x,y):
    myCmap = mclr.ListedColormap(['white','white'])
    fig, ax = plt.subplots(figsize=(12,12));
    ax.pcolormesh(x, y, 0*x, edgecolors='grey', lw=1.0, cmap=myCmap)
    ax.set_aspect('equal')
    plt.axis('off'); plt.show()

def plot_mondrian(x,y,z,colorMap):
    myCmap = mclr.ListedColormap(colorMap)
    fig, ax = plt.subplots(figsize=(20,14));
    ax.pcolormesh(x, y, z, edgecolors='k', lw=0, cmap=myCmap)
    ax.set_aspect('equal'); plt.axis('off');
    #fig.savefig('pic_Mondrian_A.png', transparency=True)
    plt.show()

def set_colors(x,fx,fy,mondrianColors,colorDistr_A,colorDistr_B,threshold):
    mx,my = x.shape
    fx, fy = scale(fx), scale(fy)
    mondrianCI = np.arange(len(mondrianColors)) # index of the colors
    z= np.zeros((mx,my))
    for kx in range(mx):
        for ky in range(my):
            if fx[kx]<threshold or fy[ky]<threshold :
                myDistr = colorDistr_B
            else : myDistr = colorDistr_A
            z[kx,ky] = np.random.choice(mondrianCI, p=myDistr)
    return z.reshape(mx,my)

#---- input section ----------------------------------------------
nx, ny = 9,9            # number of grid lines
Lx, Ly = 12, 12         # width, height of the image
Dx, Dy = 0.25, 0.25     # paramters for minimal distances of gridlines
threshold = 0.1         # parameter to switch between to color distributions

#---- set the artistic preferences -------------------------------
mondrianColors = np.array(['white','blue','red','yellow','black'])

colorDistr_A = np.array([10, 2, 4, 4, 0]);     # preferred color distribution A
colorDistr_B = np.array([2, 4, 2, 2, 15]);     # preferred color distribution B

#---- run the painting ------------------------------------------
colorDistr_A = colorDistr_A/np.sum(colorDistr_A)      # scale to unity
colorDistr_B = colorDistr_B/np.sum(colorDistr_B)      # scale to unity

x,y,fx,fy = generate_grid(nx,ny, Lx,Ly, Dx,Dy)
z = set_colors(x,fx,fy,mondrianColors,colorDistr_A,colorDistr_B,threshold)

#---- plot the results -----------------------------------------
#plot_grid(x,y)
plot_mondrian(x,y,z,mondrianColors)
for k in range(10):
    x,y,fx,fy = generate_grid(nx,ny, Lx,Ly, Dx,Dy)
    z = set_colors(x,fx,fy,mondrianColors,colorDistr_A,colorDistr_B,threshold)
    plot_mondrian(x,y,z,mondrianColors)
    print(); print(); print(); print(); print(); print(); print(); print();
plot_grid(x,y)