
- So 17 Dezember 2017
- MetaAnalysis
- Peter Schuhmacher
- #Statistics
Some more and interesting explanations can be found here: - http://hamelg.blogspot.ch/2015/11/python-for-data-analysis-part-23-point.html
import numpy as np
import pandas as pd
import scipy.stats as sst
import matplotlib.pyplot as plt
import random
import math
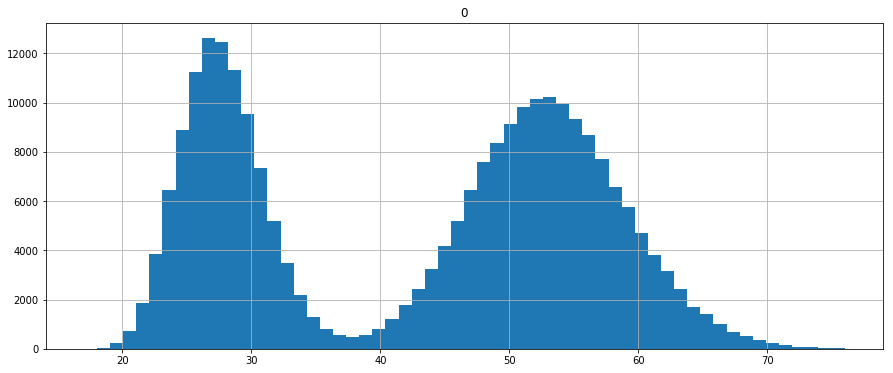
Generate a population
We generate a population with 250'000 members
np.random.seed(10)
population_ages1 = sst.poisson.rvs(loc=18, mu=35, size=150000)
population_ages2 = sst.poisson.rvs(loc=18, mu=10, size=100000)
population_ages = np.concatenate((population_ages1, population_ages2))

pd.DataFrame(population_ages).hist(bins=58, range=(17.0,76.0), figsize=(15,6))
plt.show()
Numerical evaluation of the CI
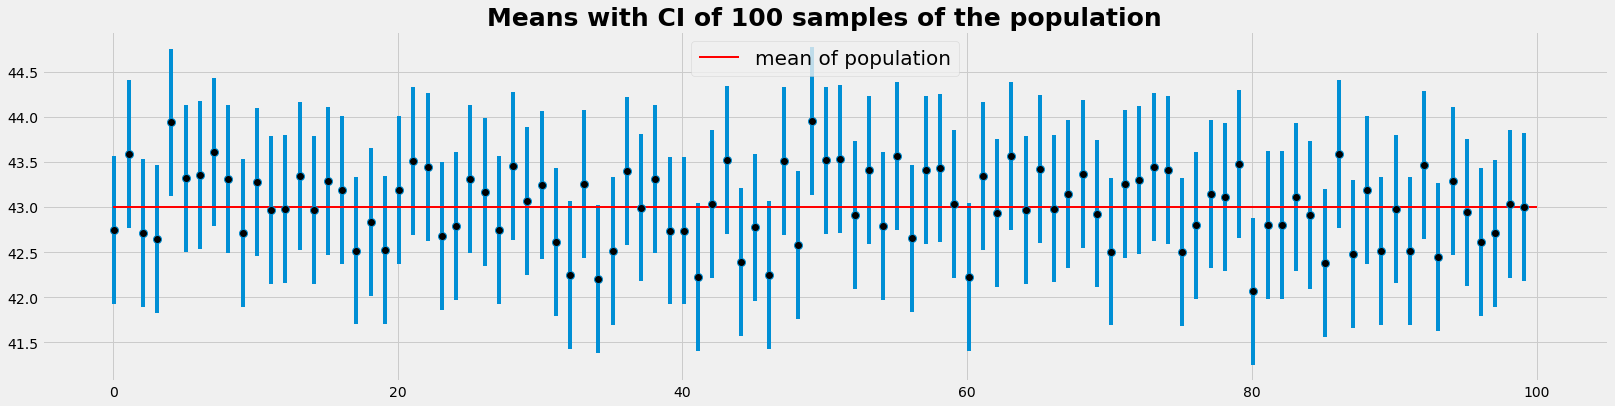
Confidential intervals of the means of several samples of the same population
- We take 100 times a random sample with 10000 elements from the population that has 250'000 elements
- For each sample we determin the mean and it's confidence intervall:
- with the z-critical value (0.975 e.g.) we determin the margins of error (meo)
- the confidence interval for a singele sample is [mean-meo, mean+moe]
- This procedure is designed to ascert that 95% of the samples have sample confident intervalls that include the parameter (here the mean) of the population
- This is the meaning of the 95% confidence intervall
- The invers closure: "The parameter has a probability of 95% to lie within the CI" , is not correct
sample_size = 1000 # size of 1 sample
Nsamp = 100 #number of experiments we run

np.random.seed(123)
intervals = []
sample_means = []

#--- statistics of the population--
pop_mean = population_ages.mean()  # mean of the population
pop_stdev = population_ages.std()    # standard deviation of the population

#---- z-value and margin of errors---
z_critical = sst.norm.ppf(q = 0.975) # z-critical value*
margin_of_error = z_critical * (pop_stdev/math.sqrt(sample_size)) # remains constant !

for samp in range(Nsamp):
    #--- take a sample and calculate the mean ---
    sample = np.random.choice(a= population_ages, size = sample_size)
    sample_mean = sample.mean()
    sample_means.append(sample_mean)
    #--- caluclate the margins and the confidence interval ---
    confidence_interval = (sample_mean - margin_of_error,
                           sample_mean + margin_of_error)
    intervals.append(confidence_interval)
Evaluation, Grafics
intv = np.array(intervals)
above = intv[intv[:,0]>pop_mean]
below = intv[intv[:,1]<pop_mean]
print(); print('Number of samples with CI above mean of population : ', len(above))
print('Number of samples with CI below mean of population : ', len(below)); print()

with plt.style.context('fivethirtyeight'):
    plt.figure(figsize=(25,6))
    plt.errorbar(x=np.arange(0.1, Nsamp, 1),  y=sample_means,
                 yerr=[(top-bot)/2 for top,bot in intervals],
                 fmt='o',ms=8, markerfacecolor='k');
    plt.hlines(xmin=0, xmax=Nsamp,y = pop_mean,
                linewidth=2.0, color="red", label="mean of population");
    plt.title("Means with CI of "+str(Nsamp)+" samples of the population", fontsize=25, fontweight='bold')
    plt.legend(loc='upper center',prop={'size': 20})
    plt.show()
Number of samples with CI above mean of population :  2
Number of samples with CI below mean of population :  1
Confidential interval of the mean of a single sample
If you know the standard deviation of the population, the margin of error is equal to:
where - σ (sigma) is the population standard deviation, - n is sample size, and - z is a number known as the z-critical value.
Note, that the standard deviation of the population is in most applications not known. So the standard deviation of the sample will be used instead usually, provided the sample has at least 30 elements (more than 100 would be nicer)..
The z-critical value is the number of standard deviations you'd have to go from the mean of the normal distribution to capture the proportion of the data associated with the desired confidence level. For instance, we know that roughly 95% of the data in a normal distribution lies within 2 standard deviations of the mean, so we could use 2 as the z-critical value for a 95% confidence interval (although it is more exact to get z-critical values with stats.norm.ppf().).
np.random.seed(10)
#--- take a sample---
sample_size = 1000
sample = np.random.choice(a= population_ages, size = sample_size)
sample_mean = sample.mean()

#--- statistics of the population--
pop_mean = population_ages.mean()  # mean of the population
pop_stdev = population_ages.std()  # standard deviation of the population

#--- confidence interval of the mean of the sample
z_critical = sst.norm.ppf(q = 0.975)  # Get the z-critical value*
margin_of_error = z_critical * (pop_stdev/math.sqrt(sample_size))
confidence_interval = (sample_mean - margin_of_error,
                       sample_mean + margin_of_error)

print("Mean of sample         :", sample_mean)
print("Mean of population     :", pop_mean)
print("Diff meanPop - meanSmpl:",pop_mean - sample_mean)
print("St_dev of population   :", pop_stdev)
print("z-critical value       :", z_critical)
print("sst.norm.ppf(q=0.025)  :", sst.norm.ppf(q=0.025))
print("margin of error        :", margin_of_error)
print("Confidence interval    :", confidence_interval)
Mean of sample         : 42.523
Mean of population     : 43.002372
Diff meanPop - meanSmpl: 0.479372
St_dev of population   : 13.2291465474
z-critical value       : 1.95996398454
sst.norm.ppf(q=0.025)  : -1.95996398454
margin of error        : 0.819935931173
Confidence interval    : (41.703064068826833, 43.342935931173173)