
- Di 03 März 2020
- MachineLearning
- Peter Schuhmacher
- #AI, #numerical, #statistics, #machine learning, #python
A confusion matrix is a summary of the prediction results on a classification problem. The number of correct and incorrect predictions are summarized with count values and broken down by each class. It gives insight into the types of errors that statistically are being made when running the model.
The confusion matrix shows how the model is statistically confused when it makes predictions.
The confusion matrix is also known as error matrix. It's exactly the same tool that is often used for the evaluation of medical interventions. A whole range of indicators can be derived from the confusion matrix. An overview with definitions is given here (https://en.wikipedia.org/wiki/Confusion_matrix).
The confusion matrix can be used for binary "yes/no" or "0/1" types of questions. But the output of a AI model or of a dignostic test is often not binary but continuous. In this case the method has to be combined with ROC- and AUC-methods (ROC = receiver operating characteristic; AUC = area under the ROC curve). An illustrative example of th ROC method is given in our Post here
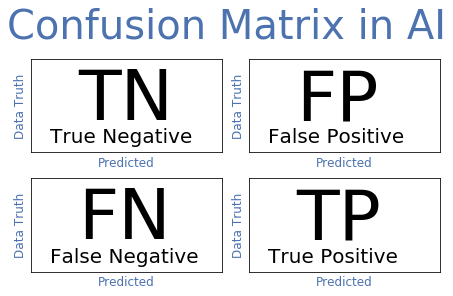
0. The confusion matrix in the AI communitiy
Unfortunately different communities arrange the elements of the confusion matrix in different ways. Due to several popular software packages a de facto standard of the confusion matrix in the AI community is given as:
import numpy as np
import pandas as pd
import seaborn as sn
import matplotlib.pyplot as plt
from sklearn.metrics import confusion_matrix, classification_report
from pandas_ml import ConfusionMatrix

np.set_printoptions(linewidth=180)
g_CM()
1. Generate labeled and predicted data
We generate two toy data series by random generator.
- \(yTrue\) stands for the with gold standard labeled data groundtruth
- \(yPred\) stands for a modelled prediction
We will evaluate and plot the error matrix with different tools.
#---- INPUT: size of data set ----
nx = 58

#---- generate data as column vectors ----
np.random.seed(1)
yTrue = np.random.randint(2, size=(nx,1))
yPred = np.random.randint(2, size=(nx,1))

print('----- Data and predictions --------------')
print('yTrue  =', yTrue.T)
print('yPred  =', yPred.T)
----- Data and predictions --------------
yTrue  = [[1 1 0 0 1 1 1 1 1 0 0 1 0 1 1 0 0 1 0 0 0 1 0 0 1 0 0 0 1 0 0 0 1 1 1 1 1 0 0 0 1 1 1 1 1 1 0 1 1 0 0 1 0 0 1 1 1 0]]
yPred  = [[1 0 0 1 1 0 1 1 1 1 0 0 1 1 0 0 0 0 1 1 1 0 1 0 0 1 1 0 1 1 0 1 0 0 1 1 1 0 1 1 0 1 1 1 1 0 0 0 0 0 1 1 1 1 1 1 1 0]]
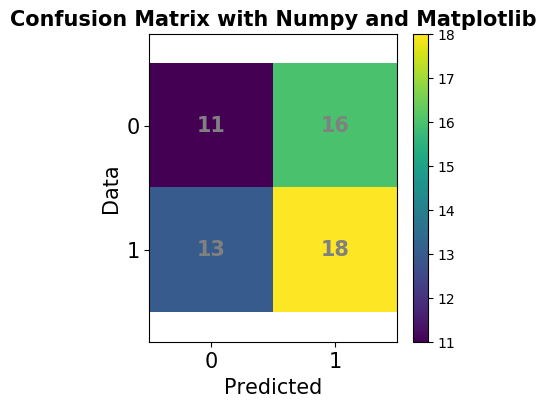
2. Confusion matrix with Numpy and Matplotlib
#print('----- Auxiliary vecotrs --------------')
yD  = yTrue - yPred;    # print('yD  = yTrue - yPred = ', yD.T)
LmP = yTrue * yPred;    # print('LmP = yTrue * yPred =', LmP.T)
LpP = yTrue + yPred;    # print('LpP = yTrue + yPred =', LpP.T); print()

#---- this methods gives the inidces of aD, LmP, LpP ---
TP, FP =  np.where(LmP==1)[1], np.where(yD== -1)[1]
FN, TN =  np.where(yD== 1)[1], np.where(LpP==-0)[1]
ConfusionMatrixNumpy = np.array([[len(TN), len(FP)],
                                 [len(FN), len(TP)]], dtype=int)
print('----- ConfusionMatrixNumpy --------------');
print(ConfusionMatrixNumpy); print()

print('---- Confusion Matrix ---------------------')
plot_ConfusionMatrix(ConfusionMatrixNumpy,ts='15')
----- ConfusionMatrixNumpy --------------
[[11 16]
 [13 18]]

---- Confusion Matrix ---------------------
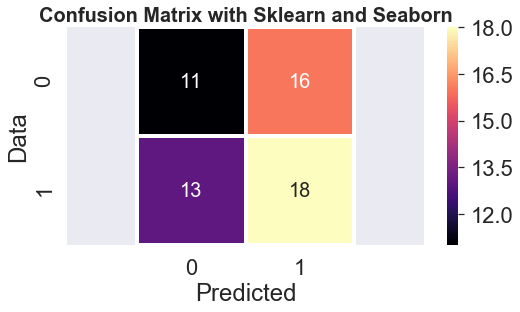
3. Confusion matrix with Sklearn and Seaborn
from sklearn.metrics import confusion_matrix
ConfusionMatrixSklearn = confusion_matrix(yTrue,yPred)
print('----- ConfusionMatrixSklearn --------------'); print(ConfusionMatrixSklearn)

Report = classification_report(yTrue,yPred)
print('----- Classification Report --------------'); print(Report)

print('---- Confusion Matrix ---------------------')
with plt.style.context('seaborn'):
    plt.figure(figsize=(8, 4))
    sn.set(font_scale=2)
    sn.heatmap(ConfusionMatrixSklearn, annot=True, square=True, annot_kws={"size":20},linewidth=3, cmap='magma')
    plt.xlabel('Predicted'); plt.ylabel('Data')
    plt.axis('equal'); plt.title('Confusion Matrix with Sklearn and Seaborn', fontweight='bold',fontsize=20)
    plt.show()
----- ConfusionMatrixSklearn --------------
[[11 16]
 [13 18]]
----- Classification Report --------------
              precision    recall  f1-score   support

           0       0.46      0.41      0.43        27
           1       0.53      0.58      0.55        31

   micro avg       0.50      0.50      0.50        58
   macro avg       0.49      0.49      0.49        58
weighted avg       0.50      0.50      0.50        58

---- Confusion Matrix ---------------------
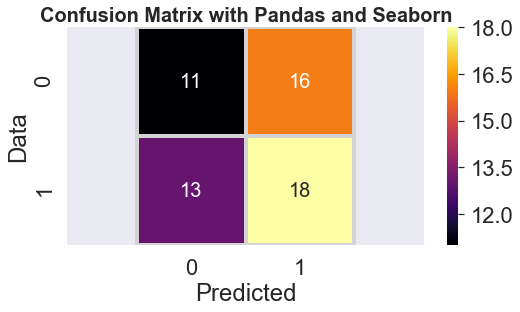
4. Confusion matrix with Pandas and Seaborn
data = {'Data':      yTrue.ravel(),
        'Predicted': yPred.ravel() }
df = pd.DataFrame(data, columns=['Data','Predicted'])

ConfusionMatrixPandas = pd.crosstab(df['Data'], df['Predicted'], rownames=['Data'], colnames=['Predicted'])
print('----- ConfusionMatrixPandas --------------'); print(ConfusionMatrixPandas); print()

print('---- Confusion Matrix ---------------------')
with plt.style.context('seaborn'):
    plt.figure(figsize=(8, 4))
    sn.set(font_scale=2)
    sn.heatmap(ConfusionMatrixPandas, annot=True, square=True, annot_kws={"size":20},linecolor='lightgrey',linewidth=3,cmap='inferno')
    plt.axis('equal'); plt.title('Confusion Matrix with Pandas and Seaborn', fontweight='bold',fontsize=20)
    plt.show()
----- ConfusionMatrixPandas --------------
Predicted   0   1
Data
0          11  16
1          13  18

---- Confusion Matrix ---------------------
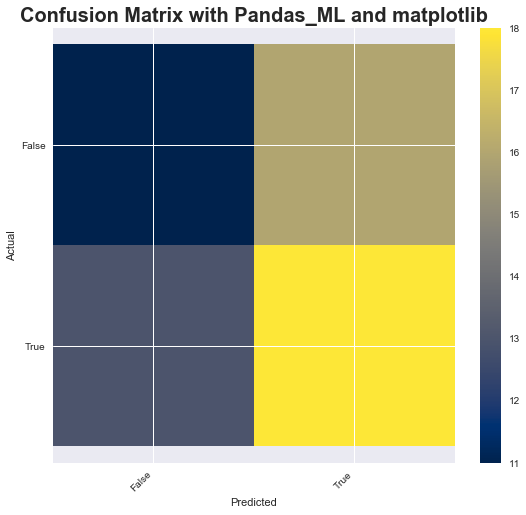
5. Confusion matrix with Pandas_ML and Matplotlib
ConfusionMatrixPML = ConfusionMatrix(yTrue.ravel(), yPred.ravel())
print('----- Classification Report --------------');
ConfusionMatrixPML.print_stats(); print()

print('---- Confusion Matrix ---------------------')
with plt.style.context('seaborn'):
    #plt.figure(figsize=(8, 4));
    ConfusionMatrixPML.plot(cmap='cividis');
    plt.title('Confusion Matrix with Pandas_ML and matplotlib', fontweight='bold',fontsize=20);
    plt.axis('equal'); plt.show();
----- Classification Report --------------
population: 58
P: 31
N: 27
PositiveTest: 34
NegativeTest: 24
TP: 18
TN: 11
FP: 16
FN: 13
TPR: 0.5806451612903226
TNR: 0.4074074074074074
PPV: 0.5294117647058824
NPV: 0.4583333333333333
FPR: 0.5925925925925926
FDR: 0.47058823529411764
FNR: 0.41935483870967744
ACC: 0.5
F1_score: 0.5538461538461539
MCC: -0.012100190051917559
informedness: -0.01194743130227005
markedness: -0.01225490196078427
prevalence: 0.5344827586206896
LRP: 0.9798387096774195
LRN: 1.0293255131964811
DOR: 0.9519230769230769
FOR: 0.5416666666666666

---- Confusion Matrix ---------------------
Code of the graphics
sn.palplot(sn.diverging_palette(200, 100, n=21))
plt.axis('off');plt.show()

def g_CM():
    fig, ((ax1, ax2), (ax3, ax4)) = plt.subplots(2, 2, constrained_layout=True)
    tSize, sSize =70, 20
    xt, yt = 0.25, 0.35
    xs, ys, = 0.1, 0.1
    Ax = [ax1,ax2,ax3,ax4]
    TF = ['TN','FP','FN','TP']
    tf = ['True Negative','False Positive','False Negative','True Positive']
    for ip in range(4):
        ax = Ax[ip]
        ax.text(xt, yt, TF[ip], dict(size=tSize));
        ax.text(xs, ys, tf[ip], dict(size=sSize));
        ax.set_xlabel('Predicted', fontsize=12, color='b')
        ax.set_ylabel('Data Truth',fontsize=12, color='b')
        ax.set_xticks([]); ax.set_yticks([])
    fig.suptitle('Confusion Matrix in AI',fontsize=40, color='b')
    plt.show()

g_CM()
def plot_ConfusionMatrix(ConfusionMatrixNumpy, ts='20'):
    # ts: text size
    y_axis = ["0", "1" ]
    x_axis = ["0", "1"]

    with plt.style.context('default'):
        fig, ax = plt.subplots(figsize=(4, 4))

        im = ax.imshow(ConfusionMatrixNumpy)

        for i in range(len(y_axis)):
            for j in range(len(x_axis)):
                text = ax.text(j, i, ConfusionMatrixNumpy[i, j],
                               ha="center", va="center", color="grey", size=ts, weight='bold')

        ax.set_xticks(np.arange(len(x_axis)))
        ax.set_yticks(np.arange(len(y_axis)))
        ax.set_xticklabels(x_axis,size=ts)
        ax.set_yticklabels(y_axis,size=ts)

        #ax.grid(which="both",color="w", linestyle='-', linewidth=1)
        cbar = ax.figure.colorbar(im, ax=ax)
        plt.xlabel('Predicted',size=ts); plt.ylabel('Data',size=ts)
        plt.title('Confusion Matrix with Numpy and Matplotlib', fontweight='bold',fontsize=ts)

        plt.axis('equal'); plt.show();

#plot_ConfusionMatrix(ConfusionMatrixNumpy, ts='18')